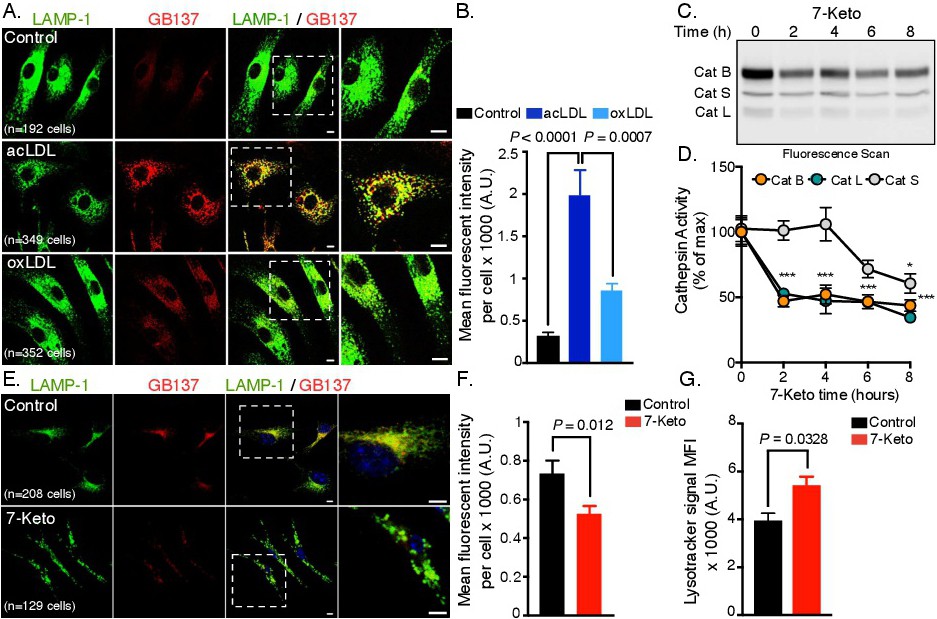
Fig. 1. Oxidized cholesterol attenuates cathepsin activity. Primary BMDMs were stimulated with modified cholesterol. (A) Confocal micrographs of BMDMs stimulated with cholesterol for 48 hours. LAMP-1 stains for lysosomes (green) and cathepsin activity (red), as indicated by GB137 fluorescent signal. (B) Quantification of the GB137 fluorescent signal from three independent experiments and subsequent one-way analysis of variance (ANOVA) with Tukey's corrections for multiple hypotheses performed to assess statistical difference. (C) Representative fluorescent gel scan (Ex/Em 532/580) and quantification (D) of BMDM cathepsin activity after 7-Keto stimulation at different time points. Data are expressed relative to unstimulated controls (time point 0) and one-way ANOVA with Tukey's post hoc analyses used to evaluate the statistical difference from three independent experiments. *, P <0.05, ***, P <0.0001. (E, F) Confocal images and quantification of lysosomal marker LAMP-1 (green) and cathepsin activity (red) in primary BMDMs with or without 8 hours of 7-Keto stimulation under low serum conditions (2% FBS). Cathepsin activity was monitored by the GB137 fluorescent signal and statistical differences were evaluated by two tailed Student's t-test from two independent experiments. (G) Flow cytometry analysis of lysotracker signal from three independent trials. Bar graphs present the mean ± SEM. The scale bar is 5μm and 2.5μm for magnified images.